|
<< Click to Display Table of Contents >> Activity Logging |
  
|
|
<< Click to Display Table of Contents >> Activity Logging |
|
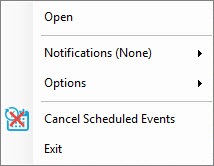
The Activity Log is a very useful utility that provides a history of actions and alarms that have been reported by Laguna. The Activity Log can be started from the Reports menu or by double-clicking on the icon in the system tray.
![]()
If you can't see the icon, refer to Tips & Tricks for setup instructions.
If you right-click on the Activity Log icon, you can enable specific option that modify the display. Use the Cancel Scheduled Events menu item to cancel the active scheduled task.
Icon Color
|
Meaning |
Blue |
Normal - no activity or no errors |
Green |
All operations have completed successfully. Once the activity log is opened, the icon color changes to blue. |
Yellow |
An operation is currently in progress |
Red |
An operation has failed and the icon will remain red until the activity log is opened. The icon remains red until the activity log is opened. Once the activity log is opened, the icon color changes to blue. |
The activity log comprises of three features:
1.Log, displays information about current activity as it happens.
2.Recent Operations, list all the controllers in the system and the status of the last operations performed
3.Quality of Service (QoS), provides a measure of how successful communications have been for each controller
Depending on the size of your system, the activity log may show a lot of data. Use the Ctrl-F hot-key to locate specific information.
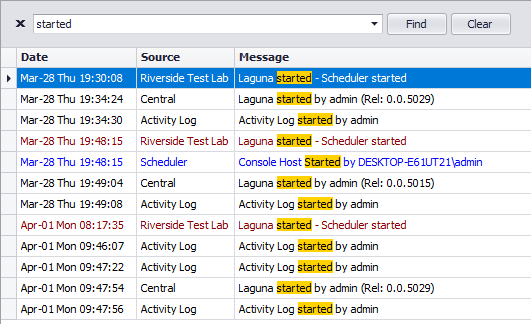
Refer to Tips & Tricks for tips on how to use filtering.
See Also