|
<< Click to Display Table of Contents >> Graph |
  
|
|
<< Click to Display Table of Contents >> Graph |
|
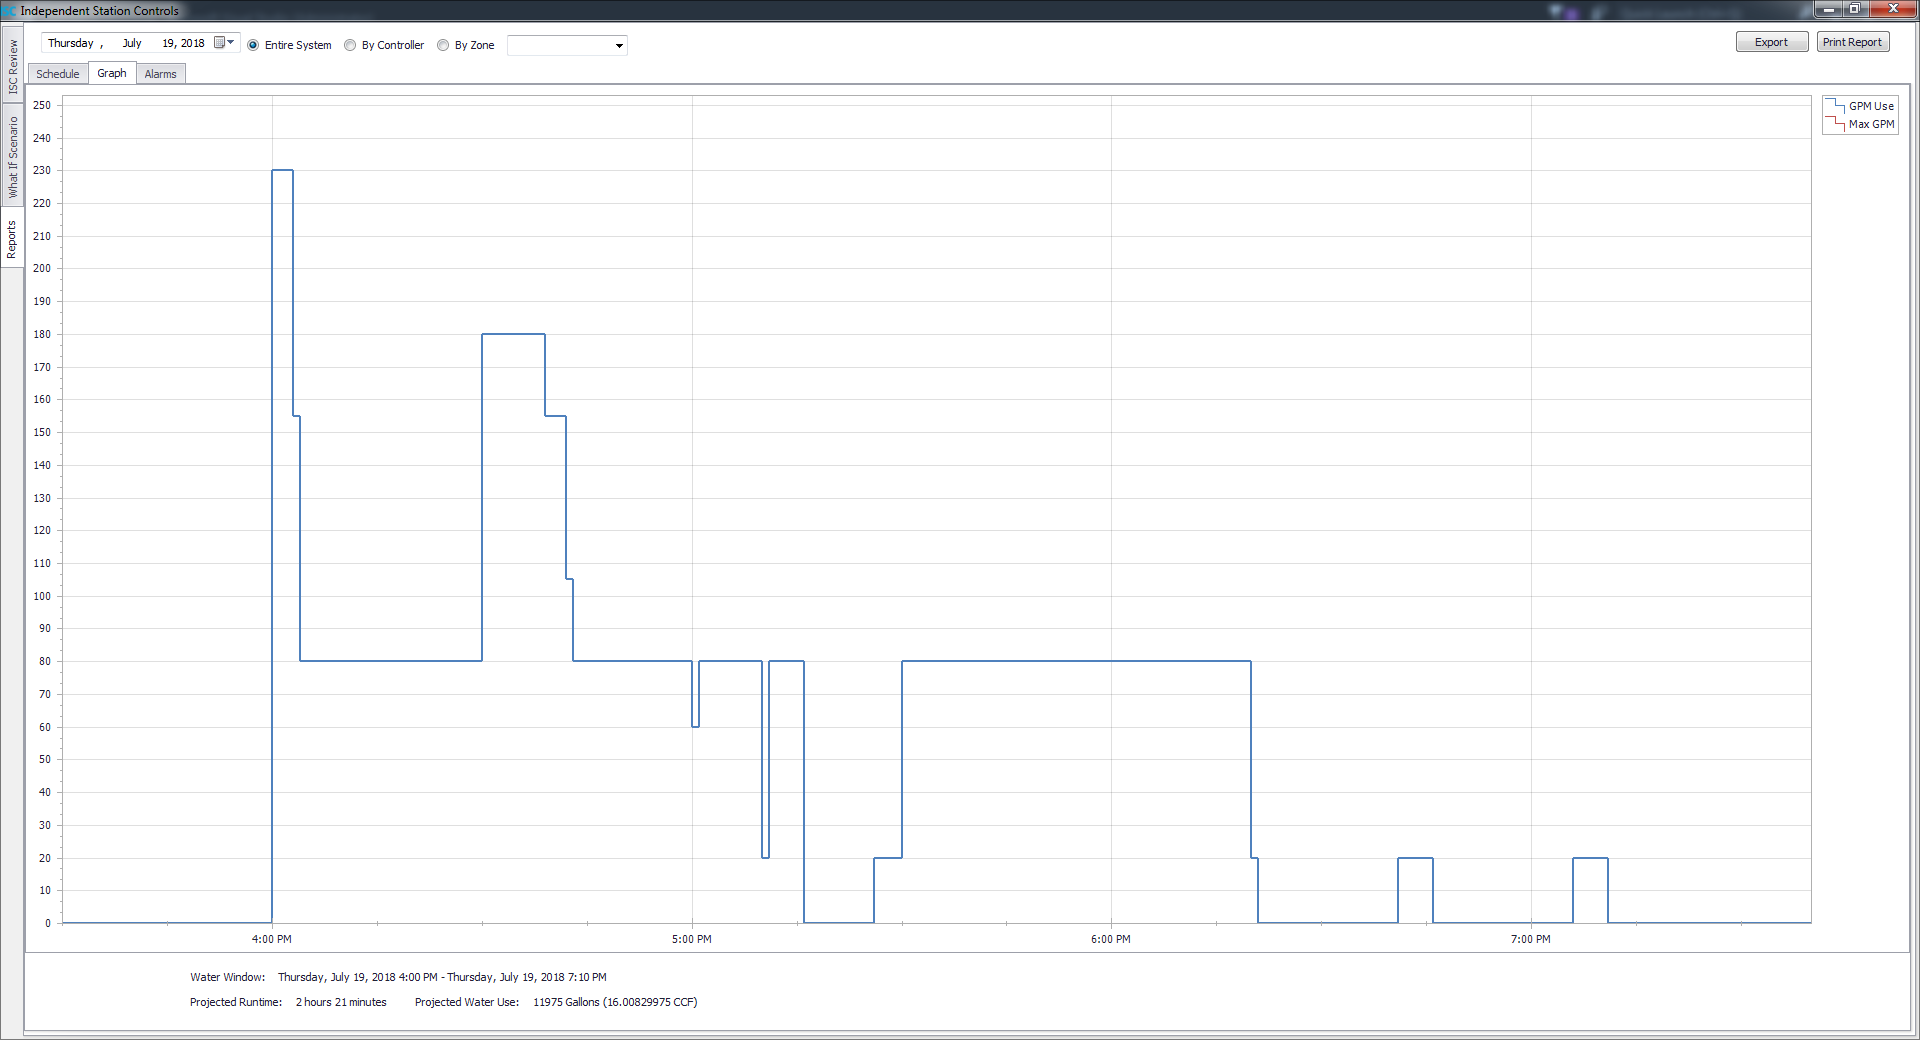
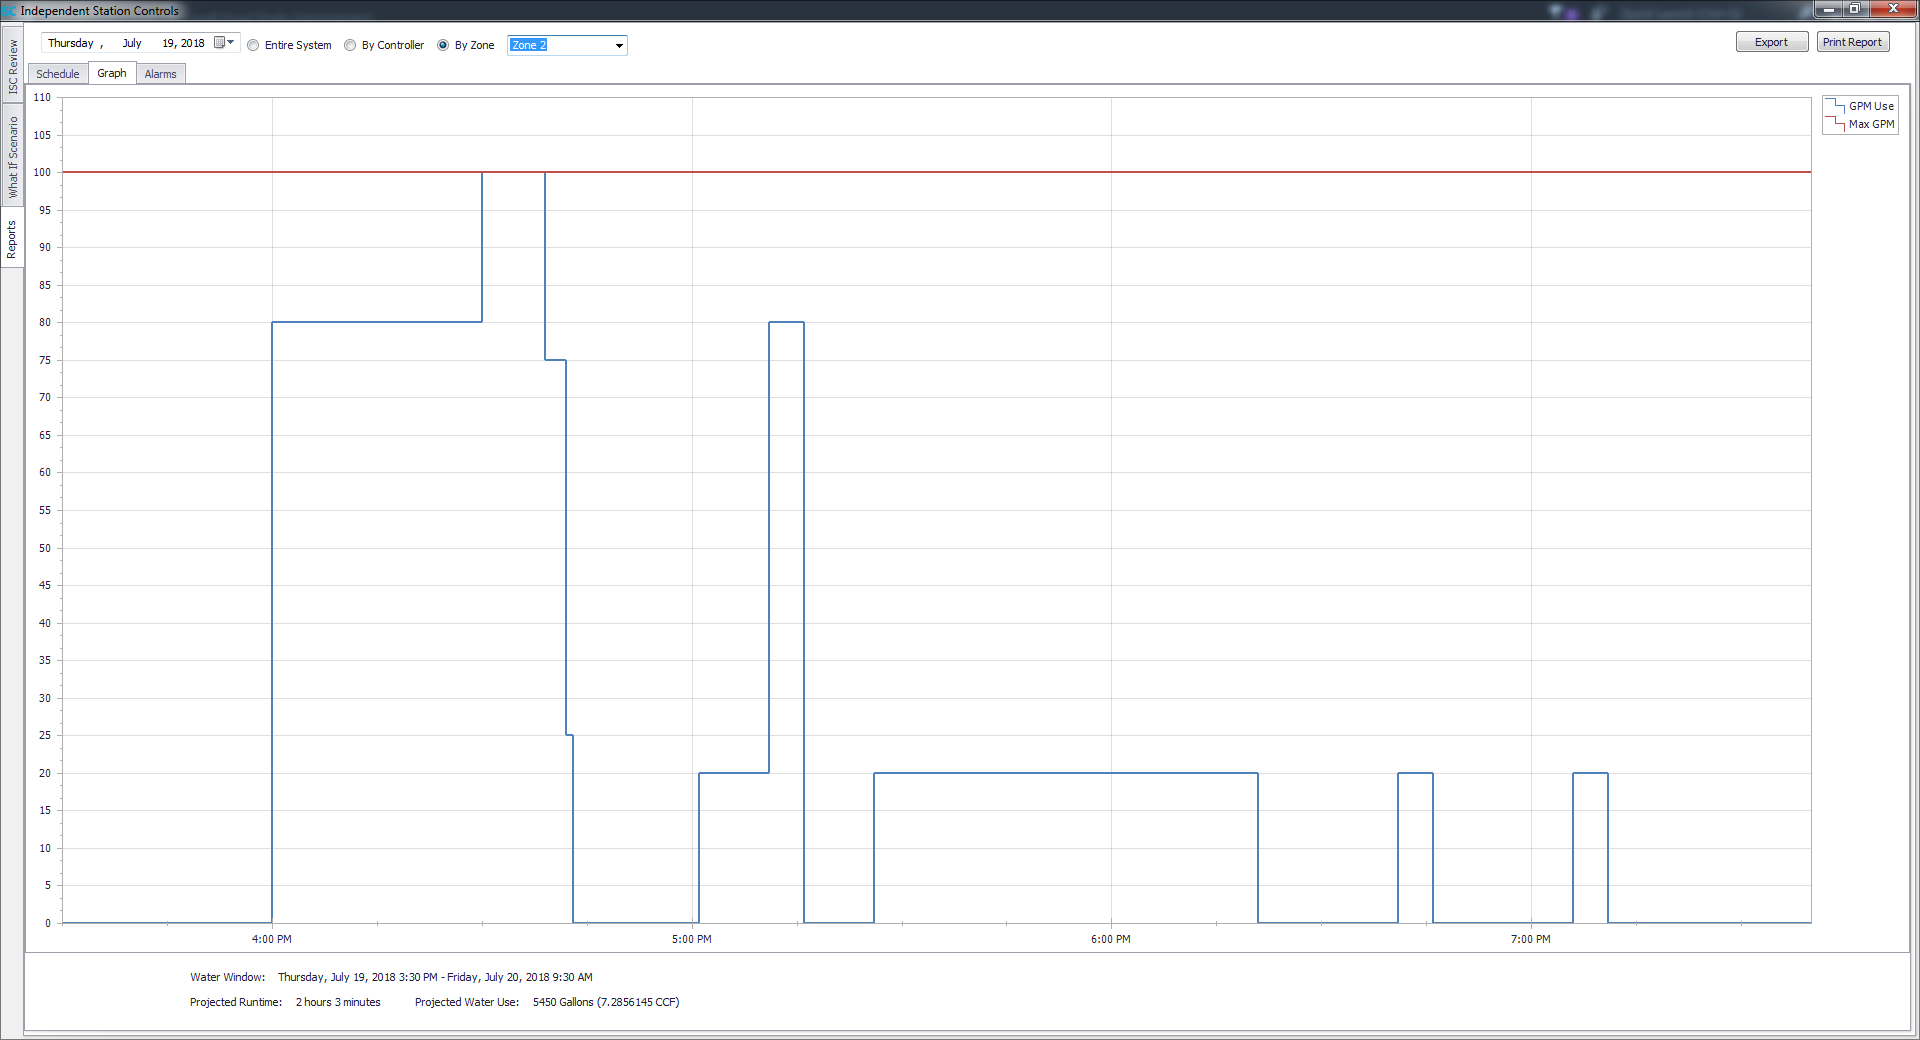
The graph tab shows the visual representation of how flow will be used over time. There is a slightly different view when selecting based on controllers and zones that shows the maximum GPM and water window for that selection: