|
<< Click to Display Table of Contents >> Moisture Sensors (2-Wire) |
  
|
|
<< Click to Display Table of Contents >> Moisture Sensors (2-Wire) |
|
Moisture sensing capability has been added to the DX3 controller, but will not adjust irrigation programming schedules based off the moisture data. A maximum of 16 moisture sensors can be connected per DX3 controller. Data will be sent to Laguna to visually display temperature and moisture data.
Moisture Sensor Setup is completely described in the Programming Actions chapter.
The Moisture Sensor Monitor comprises of three tabs:
•Data Charts- Used to visually display moisture and temperature data graphically
•Map View - Used to plot the moisture sensors on the Map
•Device Properties - Used to setup properties for each moisture sensor
From Laguna desktop,
1.Click on the Reports menu. Select Moisture Sensor Monitor.
2.Navigate to Device Properties tab.
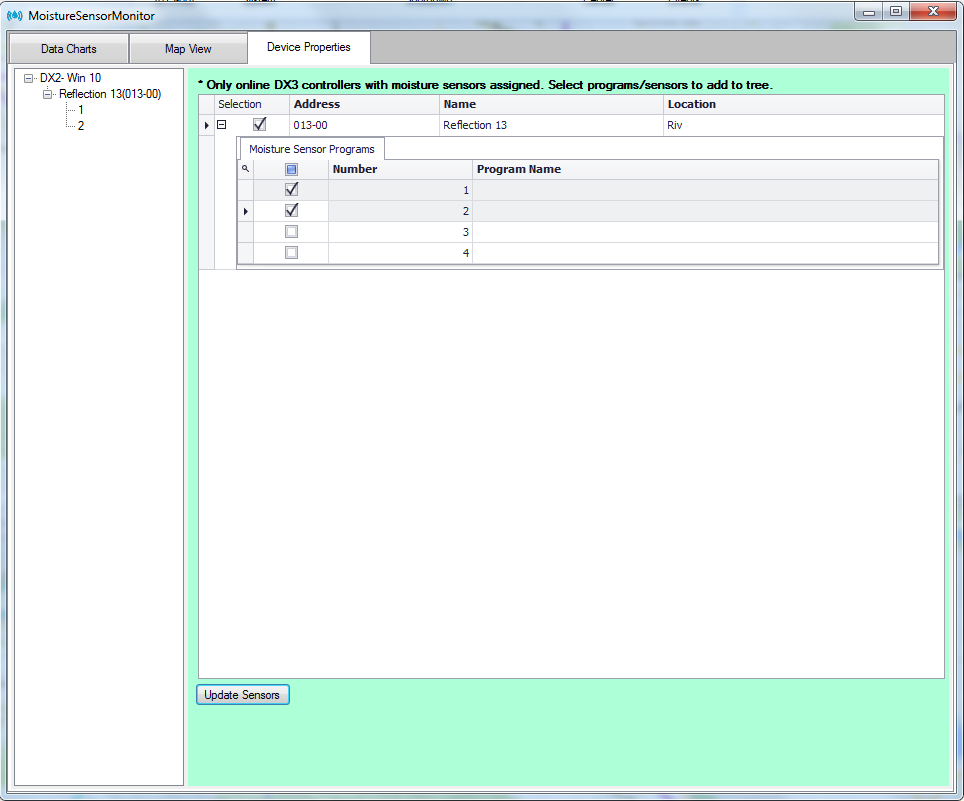
3. Select the required DX3 controller from the tree on the left pane. This opens up the list of programs/moisture sensors assigned to that DX3 controller.
4. Check the check-boxes against moisture sensors that you would like to add to the tree on the left pane.
5. Click on Update Sensors to populate the tree with the required moisture sensors.
6. Click on a particular moisture sensor in the tree.
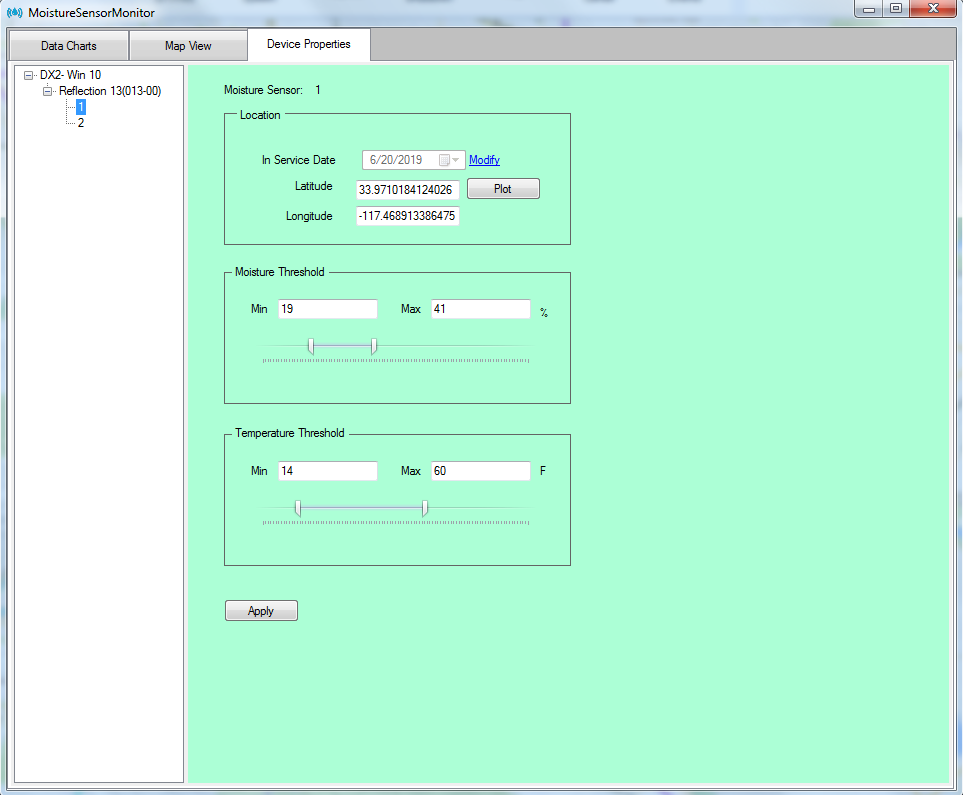
7. Properties specific to the selected moisture sensor will appear on the right side pane. Moisture and temperature thresholds for each of the moisture sensors can be set here.
8. Click on Plot button to plot moisture sensors on the Map.
9. Clicking on the Plot button will redirect you to the Map View tab. Double click on a point on the map to plot the sensor at that point.
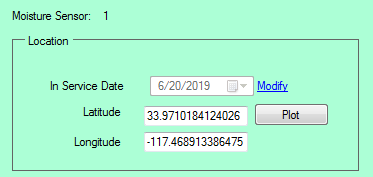
10. Once plotted, you will be redirected to the Device Properties tab; the Latitude and Longitude text-boxes will be populated with the coordinates of the point that was plotted in the Map View tab.
11. Hit Apply to save changes.
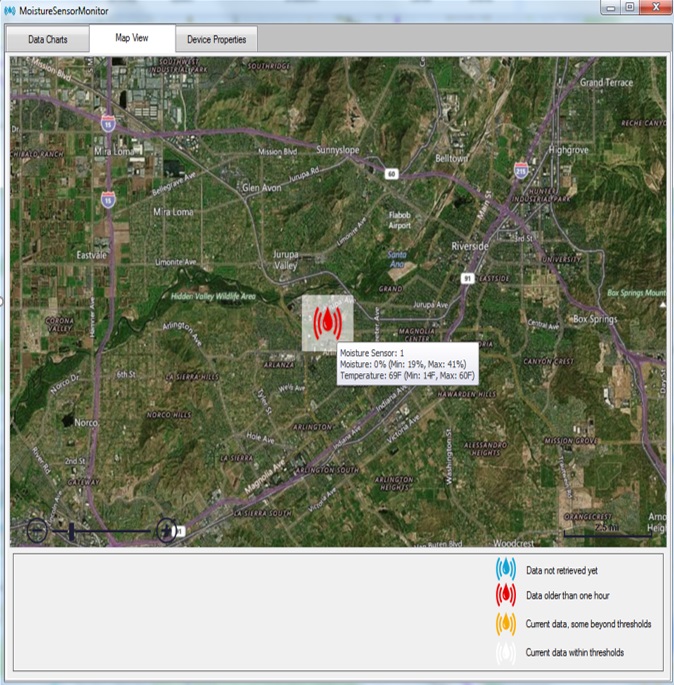
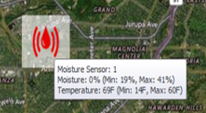
1. Double click on a point to plot the moisture sensor on the map. You will be redirected to the Device Properties tab. Click Apply to save the changes.
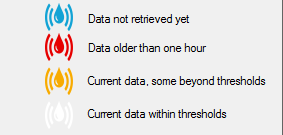
2. A legend describes what each pin color corresponds to.
Tip: The moisture sensor icon contains a tool tip that displays the last reading and the thresholds setup for that moisture sensor.
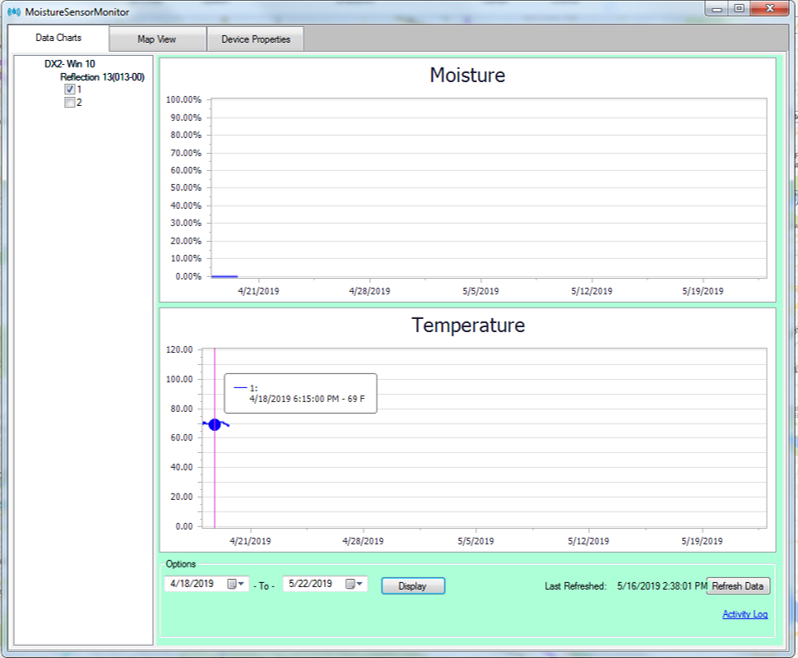
1. You can select the moisture sensors for which they would like to generate moisture and temperature charts for.
2. Select the date range and click Display to generate the moisture and temperature charts for the selected moisture senors for the specified date range.
3. Each point has a tool tip that contains the moisture/temperature value at that date stamp.
4. Click on Refresh Data to retrieve all moisture sensor data from all controllers in the database.